Stop guessing what’s performing.Start proving it.
Internal reality is what drives your decisions.
Pensero lets you compare any team, cohort, or individual side by side on real delivery, quality, and AI impact.
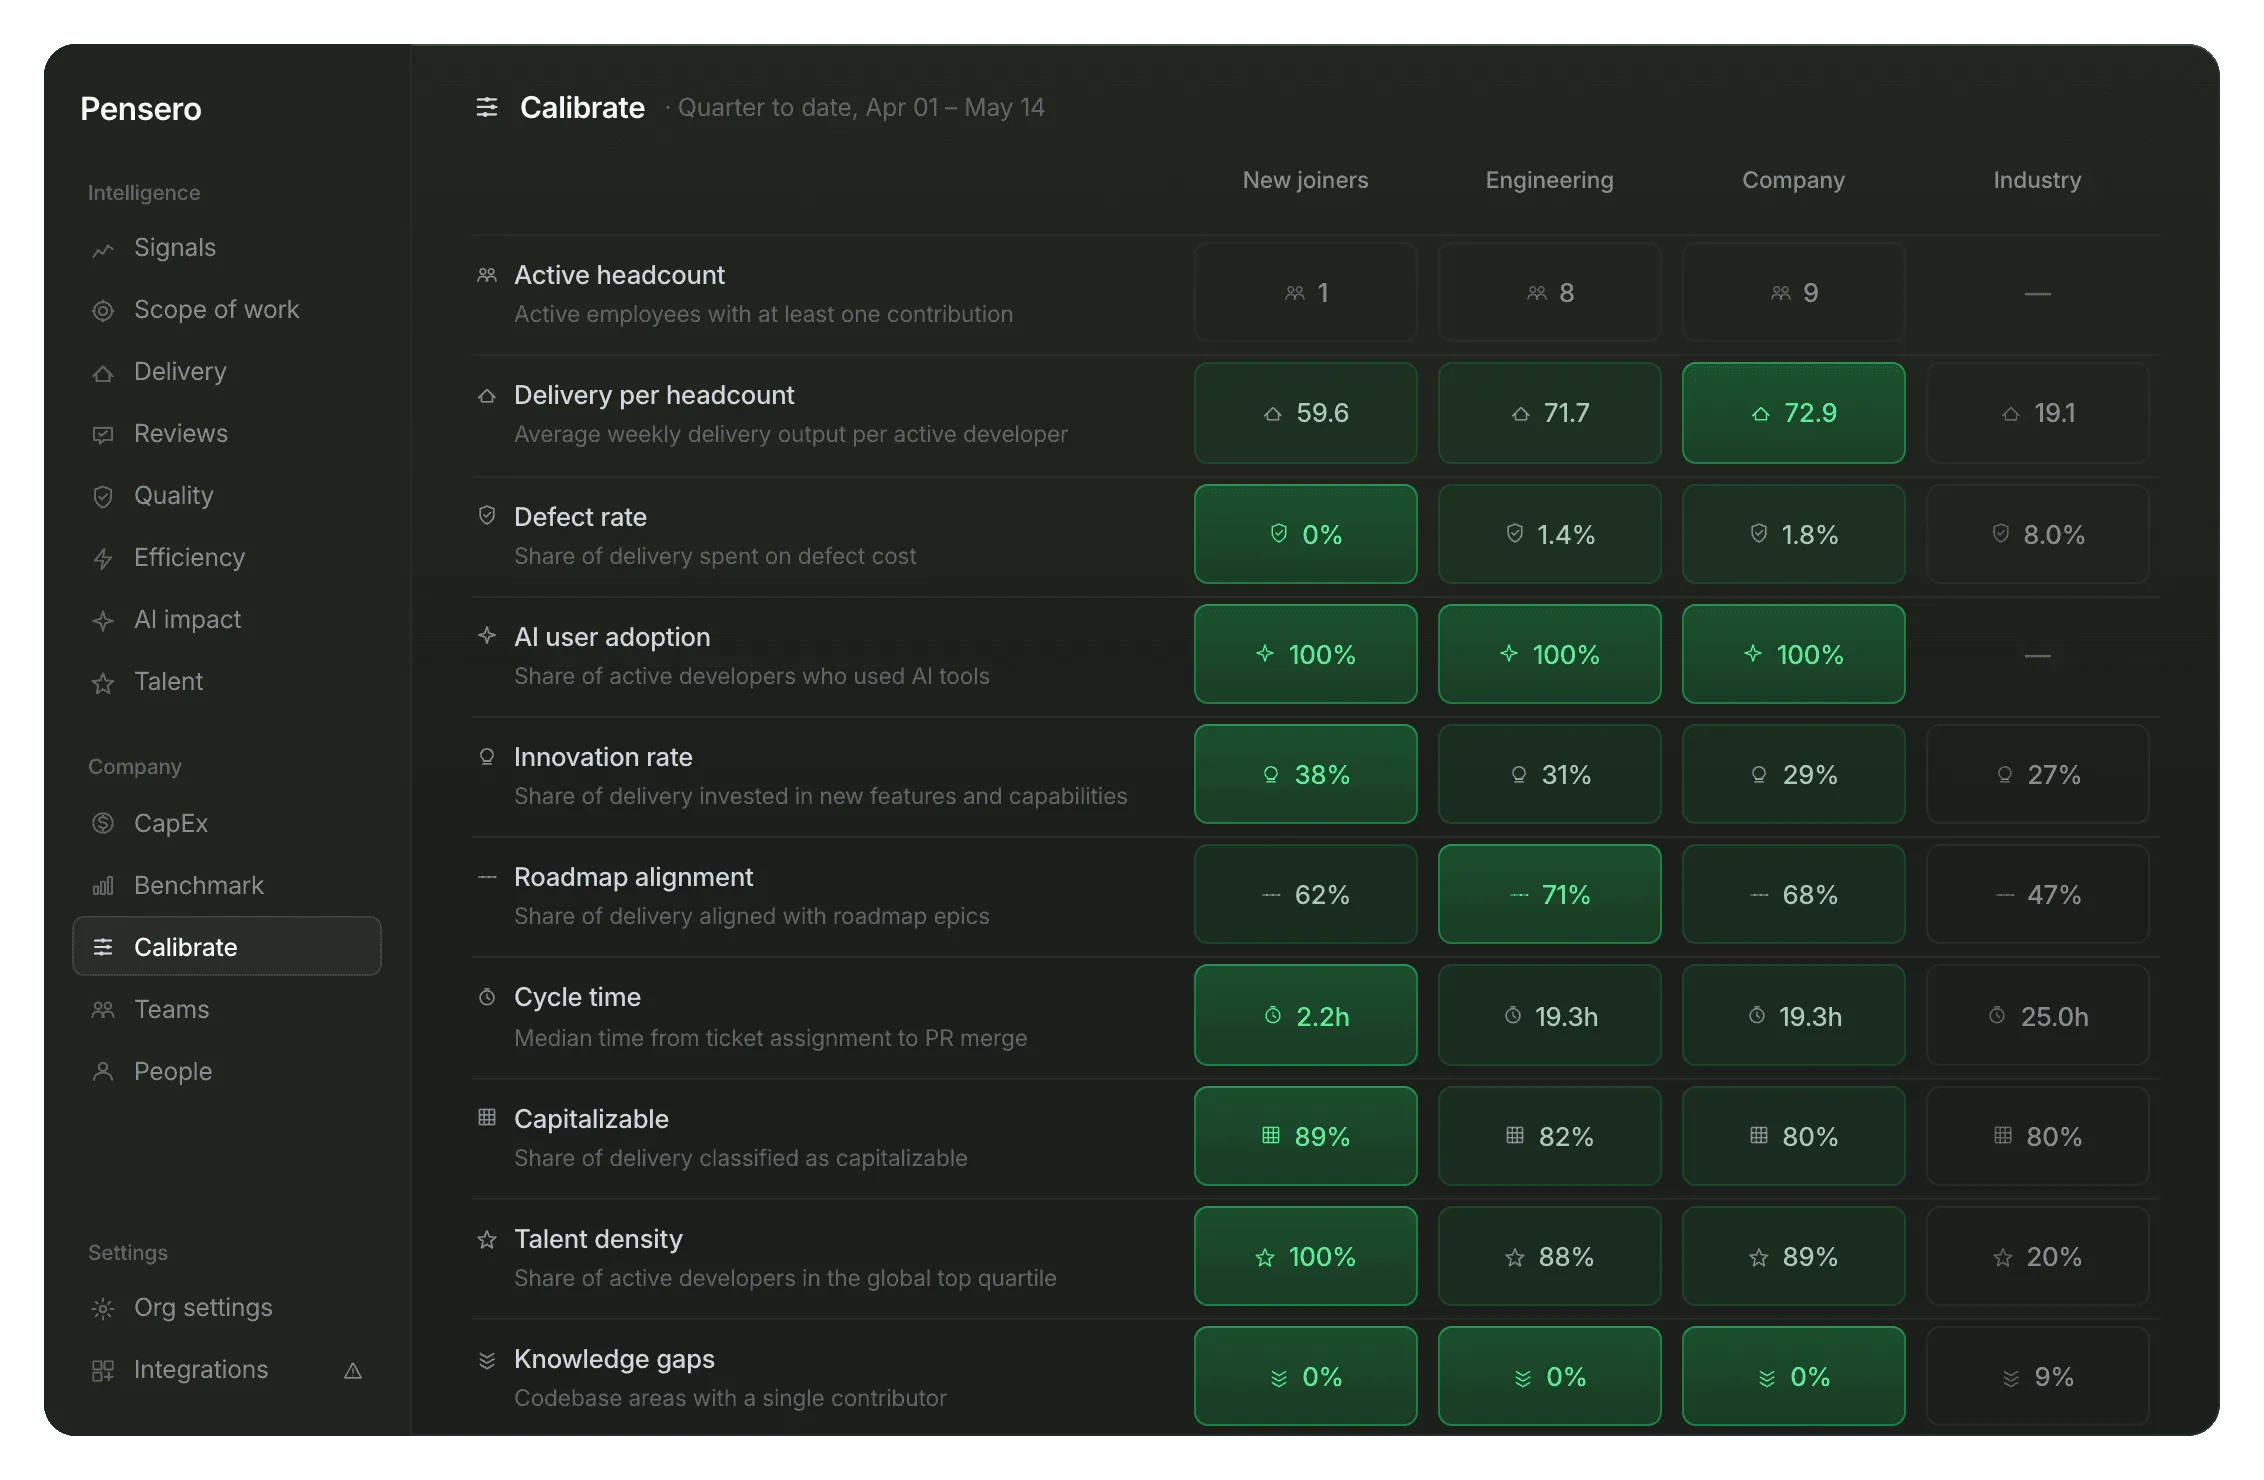
The Delivery Point™. Used at 200+ organizations.


“Pensero allows us to do it in a homogeneous way.”
Jordi AbadCTO, SEAT CODERead story → 
“One of the key signals was delivery points per headcount.”
Justin NguyenDirector of Engineering, PersuitRead story → 
“The goal is to help them learn what our best people are doing.”
Andrew EyeCEO and Founder, ClosedLoopRead story → 
“I go every morning into the email, check the first KPIs and drill down.”
Jordi MiróCTO, ZynapRead story → 
“Pensero gives me daily peace of mind.”
Jose-Luis VilarCo-founder and CPTO, Caravelo
Tools
Other tools show activity.Pensero shows relative performance.
Objective visibility into every engineering contribution.
Other tools show
- Tickets closed
- PRs merged
- AI adoption rates
Pensero shows
- Contribution imbalances across the team
- Knowledge silos and gatekeeping patterns
- Review effectiveness and speed gaps
Platform
One view to compare teams, people, and cohorts.
Always with real context
Numbers only matter in comparison, never in isolation.
Every view includes:
- Company average
- Industry median
Understand if performance is strong, weak, or just average, instantly.
New hires Staff+ Company Industry Delivery 37.0 61.4 57.4 55.9 Quality 25% 13% 15% 18% Cycle time 39h 29h 34h 41h AI Impact 58% 72% 71% 54% 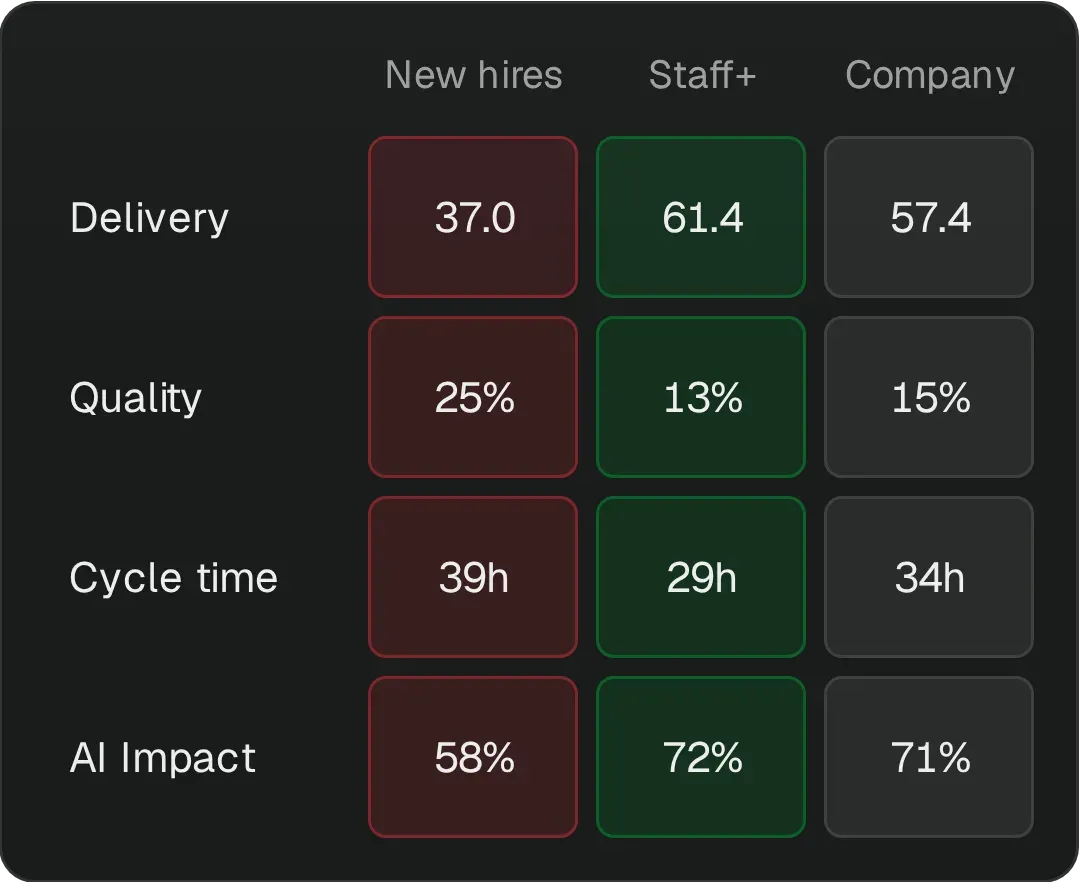
Understand performance across individuals
Move from subjective reviews to evidence-based decisions.
Compare:
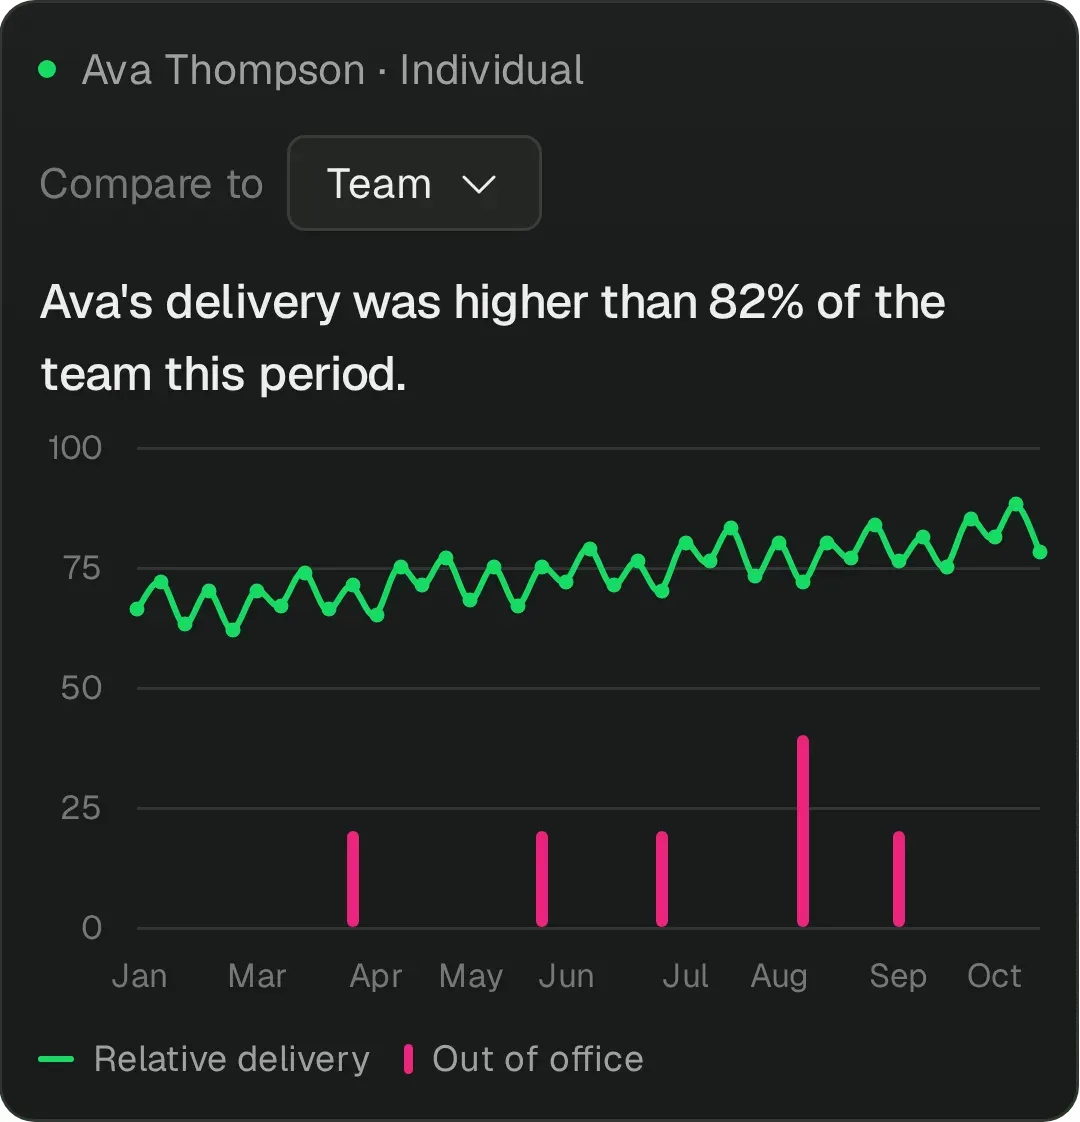
- Individual vs team average
- Individual vs peers
- Individual vs industry
Use it for:
- Promotions
- Performance reviews
- Probation assessments
- Identifying top performers and support needs
Ava Thompson · IndividualCompare toTeamAva's delivery was higher than 82% of the team this period.1007550250JanMarAprMayJunJulAugSepOct- Relative delivery
- Out of office
Compare any group, not just teams
Org charts don’t answer real questions.
Pensero lets you compare:
- New hires vs tenured engineers
- Contractors by vendor
- Remote vs onsite
- Seniors vs mid-levels
- Any cohort you can define
If you can describe the group, you can compare it.
AllContributorsTeamsCohorts512 Eng. + AgentsCohort · 512 peopleRemoveAI adoptersCohort · 364 peopleRemovePlatform38 peopleRemoveCustomer Portal190 peopleRemoveDevinPaymentsRemove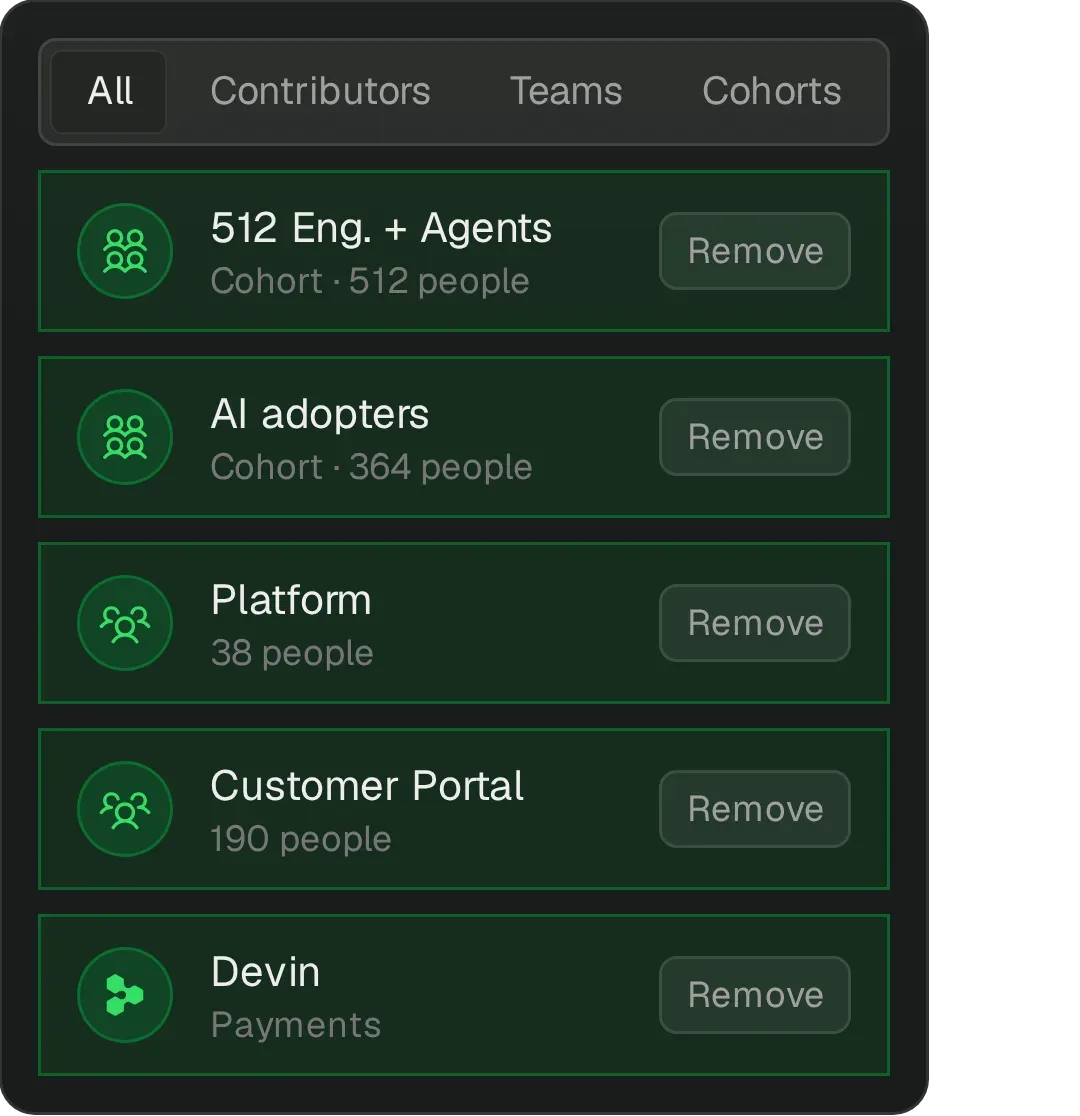
Compare teams side by side
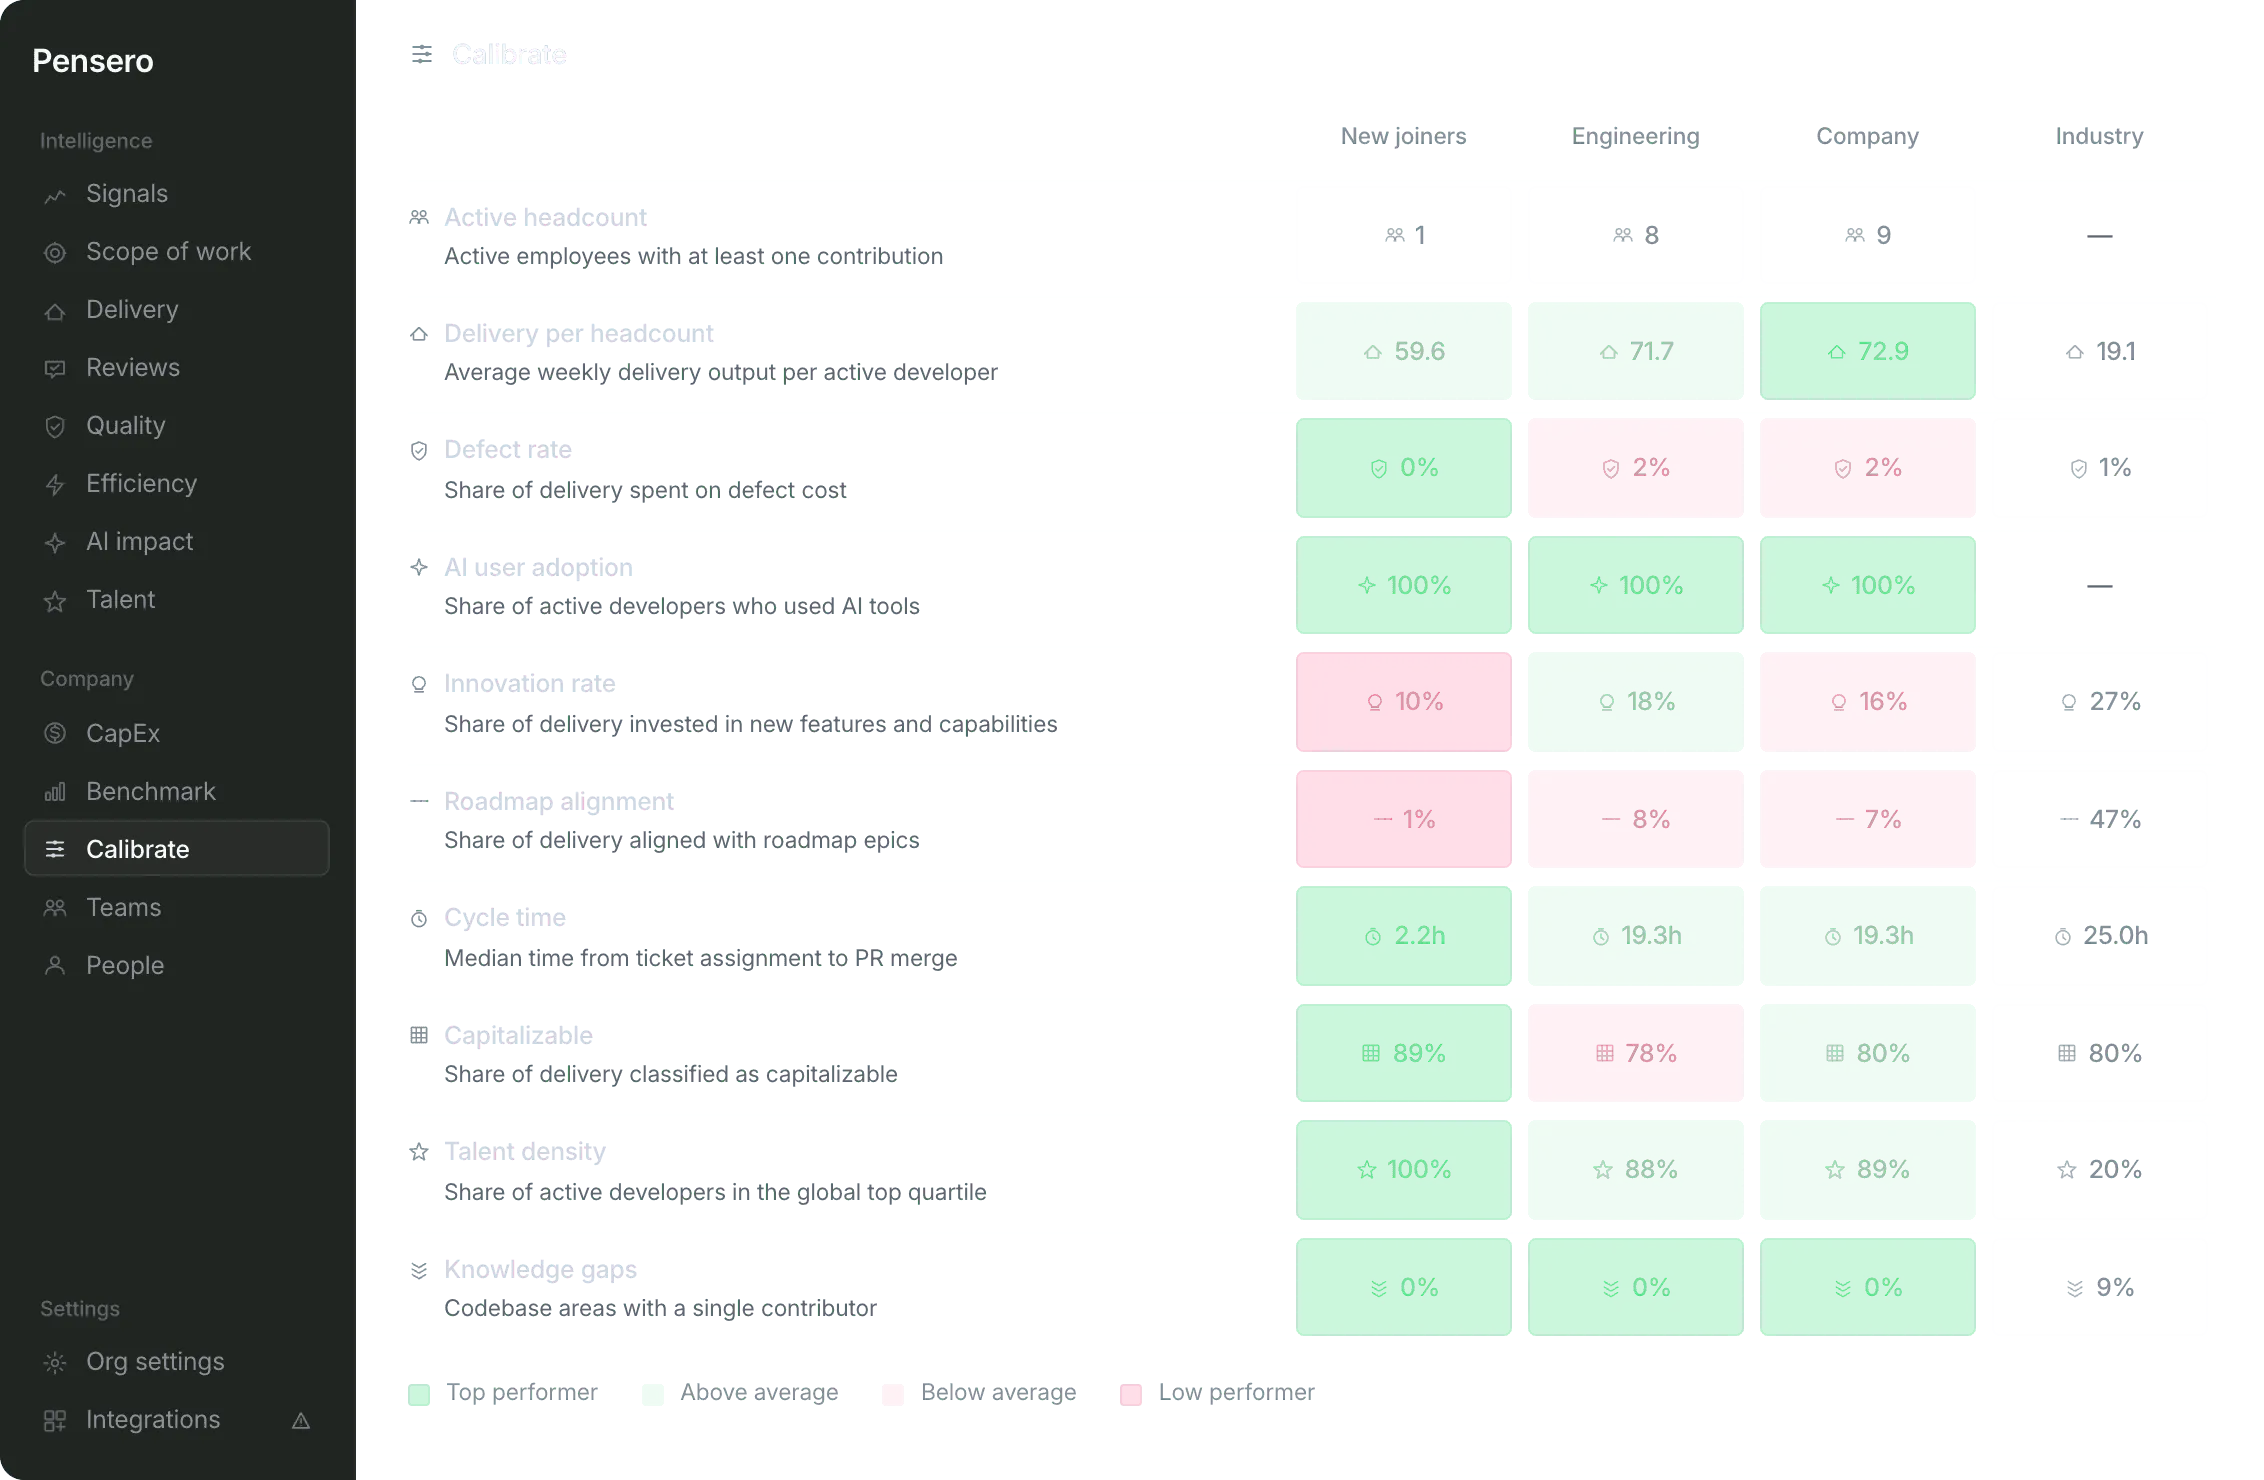
See how your teams actually perform relative to each other.
Compare:
- Delivery per headcount
- Defect rate
- AI adoption
- Collaboration patterns
Patterns surface instantly — no digging, no interpretation layers.
Platform Payments Mobile Company Industry Delivery 60.8 60.1 54.0 57.4 55.9 Quality 11% 17% 14% 15% 18% Cycle time 26h 31h 35h 34h 41h AI Impact 89% 68% 64% 71% 54%
Color-coded scoring (above/below company & industry)
Built for decisions.
How it works
Get started in minutes. See insights in hours.
Connect your stack. See months of history from day one.
1 hour
Connect & Structure
Integrates repositories, tickets and messages automatically so AI can break work into measurable units, giving your team a unified, transparent view of everything delivered.
1 day
Analyze & Detect
Surface delivery vs roadmap gaps, AI contribution patterns, and execution insights so bottlenecks and early performance drag become visible through evidence-based reviews.
1 week
Report & Decide
Establish a single source of execution truth with team-level and AI vs human performance comparisons, enabling board-ready reporting and confident, scalable capital decisions.